WEB
GA4 + Search ConsoleWebsite Performance
2,520website sessions
- Google impressions
- 21,000
- Organic search clicks
- 160
- Visitors
- 2,280
- Key actions
- 116
- GA4-reported revenue
- $5,400
Marketing Command Center & Performance Center
See website analytics, connected channel performance and physical campaign results together. Follow the data behind each result and use AI insights to decide where to focus next.
Explore the upgraded platform
See what brings people in, what produces revenue, and what to do next. Try the cards below to follow the results.
Read the $3,000 marketing exampleYour marketing, together.
Website traffic, connected channels and measurable outcomes.Explore the details: Click the button at the bottom of any card to drill into its results. Website and social cards reveal example traffic URLs, posts and topics. Use “Inspect evidence” to see what supports a recommendation.
Showing illustrative results for September 1–28, 2026
10% off offer · $1,200 spend
Free appetizer · $1,200 spend
Awareness campaign · $600 spend
Organic video performance
Why: Meta reported 90 purchases and $4,500 in value. Google reported 18 conversions and $900 on the same spend.
Next: Test the offer with comparable targeting. Compare purchases, revenue and cost per purchase before shifting budget.
Why: 8 leads cost $600—$75 per lead. No sales value is recorded, so the revenue outcome is still unknown.
Next: Match those leads to closed sales before increasing or reducing the LinkedIn budget.
Illustrative demo, not live customer results. The shorter period shows a simplified sample subset. GA4 and ad-platform revenue may overlap; do not add them together. Available metrics depend on account permissions and tracking. Recommendations do not automatically change spend.
Connected measurement
Vivid preserves the relationship between the originating spot, engagement, campaign cost, conversion activity and customer revenue.
Understand visitor activity and traffic sources from connected website analytics.
Review available spend, impressions, clicks and engagement for connected accounts.
Scans, offer clicks, Maps actions and Waze actions; social engagement where provided by the source.
Review recommendations, then investigate the relevant channel or campaign data.
Validated outcomes connected back to the exact campaign and spot.
Conversion value attributed through the Vivid campaign path.
Allocated cost, CPM and cost per conversion.
ROI based on attributed revenue compared with campaign investment.
Physical campaign performance
Rank advertisers, locations and advertising placements using the same connected performance data behind executive totals.
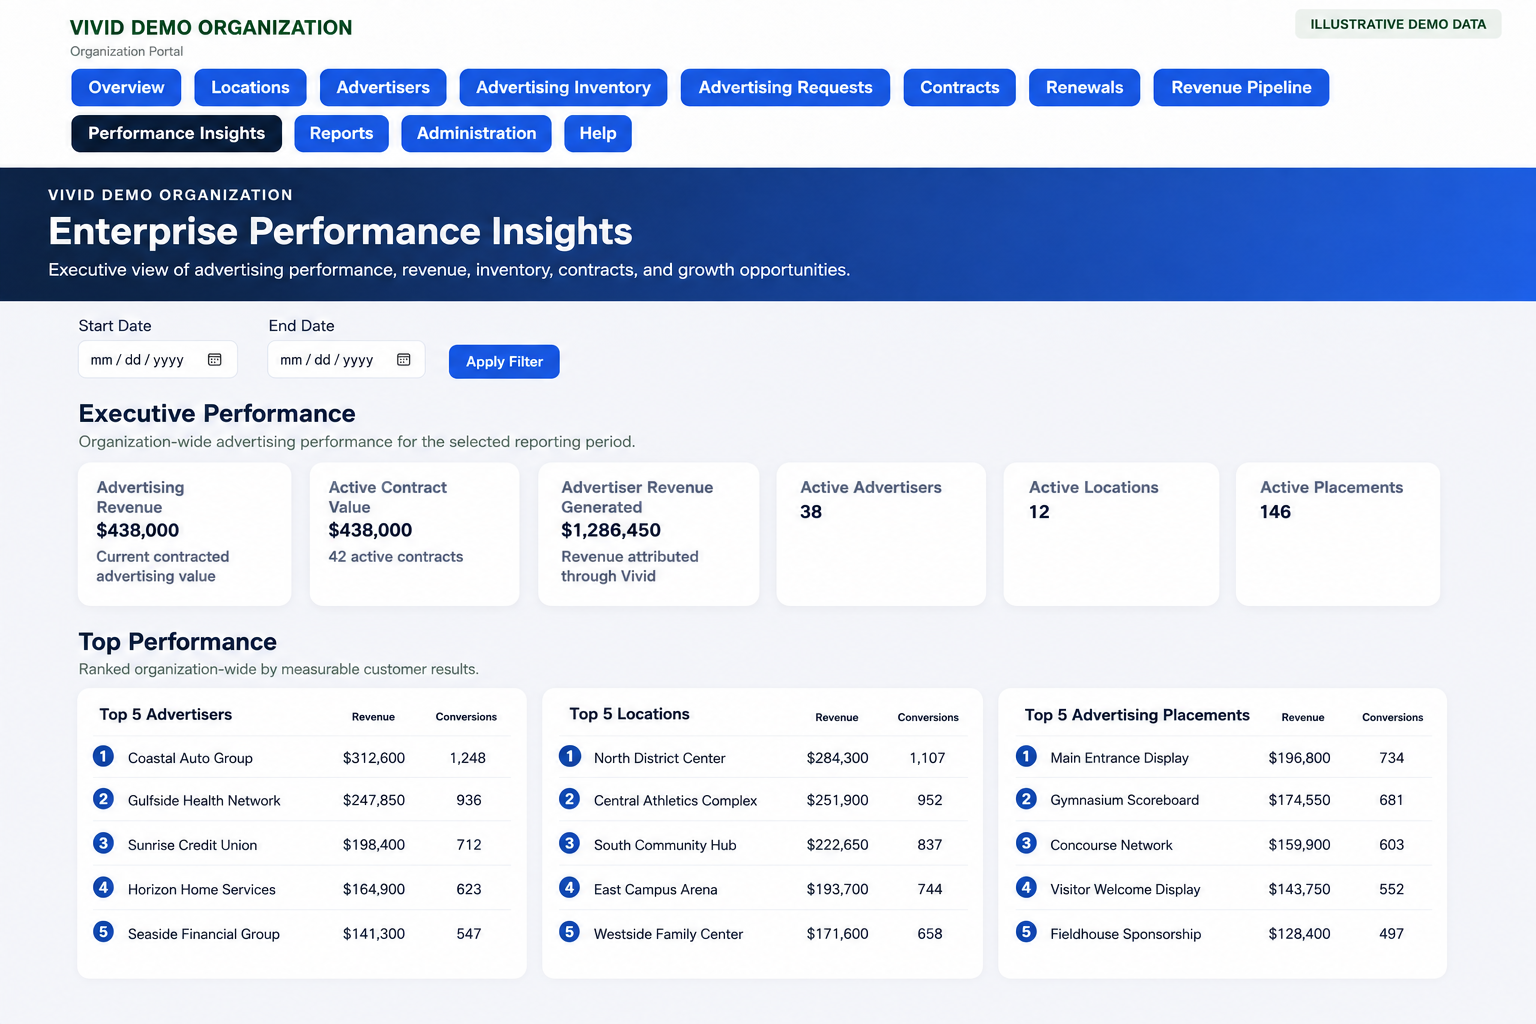
Executive to exact detail
Date filters and consistent calculations keep each view aligned to the same reporting period and source data.
Executive performance across the complete operation
Local inventory, campaign activity and customer outcomes
Active days, allocated cost and exact event history
Delivery, engagement, conversions, revenue and ROI
Performance history across locations and campaigns
From attribution to retention
Vivid keeps scans, clicks, customer intent, conversions, attributed revenue, cost per conversion and ROI connected to the exact advertiser, location, spot, campaign and contract period. Both sides can see the same evidence before renewal, optimization or expansion decisions are made.
Demonstrate the exact value of a specific spot
Enter renewal conversations with credible performance data
Identify the best campaigns, locations and offers
Improve underperforming campaigns before the contract expires
Use proven results to support renewals, upsells and new sales
Reporting & history
Filter by date, export at the level you need, preserve historical reporting and restore archived records without breaking the performance trail.
Measure the complete outcome